Chemical Enhancement vs Molecule–Substrate Geometry in Plasmon-Enhanced Spectroscopy
- Light
Published:
Raman spectroscopy is a powerful nondestructive method suitable for analytical chemistry that provides molecular fingerprinting, structural, chemical, mechanical, and thermal information about a sample. Coupled to an optical microscope, Raman spectroscopy enables chemical inspection at the microscale with exciting applications in single-cell or single- molecule investigations1,2 and advanced nanoelectronics.3−5 However, conventional Raman spectroscopy suffers from low signal intensity due to its inelastic scattering nature. Here is where the combination of Raman spectroscopy and plasmonics propelled 6the field by joining high specificity and high sensitivity. Since its discovery in the 1970s and its widespread application in the early 2000s, surface-enhanced Raman spectroscopy (SERS) revolutionized conventional Raman spectroscopy applications, allowing for a wide range of applications from monitoring surgery operations to warfare.7−9 However, SERS has not been free of polemics; quite the contrary, since the 1980s until nowadays, the exact mechanisms of SERS and their degrees of contribution are still under debate. The scientific community’s consensus is that
SERS’ primary enhancement mechanism originates from the highly localized electric field near plasmonic (nano)particles, i.e., the electromagnetic enhancement mechanism (EM). In addition to the EM effect, the so-called chemical enhancement mechanism (CM), originating from the locally modified electronic structure of the molecule due to the proximity to the plasmonic system, was also discussed. The degree to which CM contributes to SERS or even its existence has been critically investigated and debated, particularly by Andreas Otto (pro-CM)10,11 and Martin Moskovits (contra-CM).12 We recommend the readers to consult those works, which are also interesting readings on their own. Furthermore, recent theoretical insights were provided on the local chemical sample-nanoparticle interactions in plasmon-enhanced spec- troscopy addressing the entire CM.13−17 The interactions include nonresonant, resonant, and charge-transfer contribu- tions, entirely based on quantum chemical simulations. Computational results indicate the enhancement of specific vibrational modes by several orders of magnitude, merely originating from the CM.18−20 Especially in the scope of TERS, considerable amplification of specific modes might be connected to charges localized at the apex atom of the tip’s frontmost plasmonic nanoparticle, as shown very recently by our group.
The signal amplification in SERS can be explained by considering the factors that determine the Raman intensity. CM in plasmon-enhanced techniques originates from the local variation of the molecule’s polarizability, which induces spectral variations in frequency and (relative) intensity. On the other hand, the EM effect leads to highly localized electric fields boosting the overall Raman intensity. The EM contribution to SERS increases the electric field factor, while the CM contribution affects the molecule’s polarizability. The CM is considered to involve charge-transfer processes between the plasmonic nanoparticles and the molecular analyte.21 More precisely, there are other hardly explored factors involved in CM: (1) the symmetry of the molecule upon adsorption that is related to changes in geometry and the electronic structure of the molecule in the ground state,14 (2) excitation to excited states of the molecule,22 (3) excitation to charge-transfer states between the molecule and the substrate, i.e., resonant enhancement,17 and (4) resonant processes involving plasmonic effects of the substrate.23 Most notably, the CM is closely linked to plasmon-driven photocatalysis, which is an emerging topic of a broad interest in the chemistry, catalysis, and materials science communities.24
Metal phthalocyanines are organic semiconductors that attract interest in several fields, from fundamental research to technological applications. Although the understanding of the molecular orientation of phthalocyanine films on solid substrates is an old problem investigated as early as over 30 years ago,25 the investigation of charge-transfer phenomena involving (metallo)phthalocyanines at the nanoscale are just recently gaining considerable attention to probe catalytic reactions at the molecular scale.26,27 Phthalocyanine molecules were recently introduced as a model system to investigate organic electronics,28 spintronics,29 and plasmonic structures.30 The wide use of phthalocyanines is also facilitated by their temperature stability, allowing thermal evaporation to produce films with controlled thickness. Most metallophthalocyanines feature a planar geometry with D4h symmetry in the gas phase.31 In particular, scanning tunneling microscopy (STM) had been used extensively to achieve molecular resolution of phthalocyanines and their porphyrin parent structure(s). The STM image of CoPc on Au(111) showed the flat adsorption geometry of the molecule and the Kondo effect32 originated from metal electrons coupled to localized spin states of the Co atom.
In particular, for the CoPc case, it was reported that molecules tend to adsorb flat-lying on terraces for different single crystalline surfaces Au(111),32,33 Au(100),34 Ag(111),35,36 vicinal gold surfaces37 and even other related molecules as the perfluorinated CoPcF16 on a polycrystalline gold surface.38
At submonolayer concentrations, CoPc on Au(111) assembles in linear structures at room temperature.39 The molecule orientation is predetermined by the nitrogen and the benzene rings of the isoindole compound interaction with the Au(111) surface.40 Similar orientations were reported for Cu(111) and Ag(111) surfaces for Co atom adsorption on top of a metal atom of the upper surface layer. However, different distortions of the macrocyclic ring were predicted by DFT.36,40 In the case of CoPc on Cu(111), a slight umbrella shape with a longer distance of Co−Cu than the external benzene rings was reported. Meanwhile, in the case of CoPc on Ag(111), the macrocyclic ring has a longer average distance than the Co−Ag bond. Even in the case of planar adsorption, the Pc macrocycle undergoes a slight nonplanar distortion due to the smaller Pc- metal surface interaction distance with respect to the Co-metal surface.
It was reported that phthalocyanines experience symmetry reduction during adsorption. CoPc molecules lower their symmetry from C4 to C2 on Cu(111), which is observed from the intramolecular features in STM images.41,42 Symmetry reduction was observed for different phthalocyanines with central metal atoms: CuPc and FePc on Cu(111), PdPc and PtPc on Ag(111).42 Recent STM imaging of CoPc on Ag(110) shows two intramolecular contrasts. A visualized intra- molecular bonding of the lone pair imine nitrogens with C− H bonds neighbors on Ag(110) was demonstrated by inelastic electron tunneling with a CO-terminated tip.43 Meanwhile, a different bonding structure was measured for CoPc on Au(110) × 2, where the metal interaction induced the C−H outline branching of the bonds.44 The symmetry reduction and different C−H bonding to the external benzene rings for different surface substrate lattices can drastically change the vibration intensities observed in the Raman spectra. It is important to remark that symmetry reduction can occur due to the modification of molecule−surface adsorption geometry and electronic structure. That is, a variation of the electronic structure leads to a structural change and vice versa. Even though STM and tunneling spectroscopy accompanied by DFT calculations had been powerful tools to elucidate the local electronic structure and the adsorption geometry of phthalocyanines,45 Raman spectroscopy allows determining structural changes related to molecule−molecule and mole- cule−substrate interactions.
This work aims to assess the contribution from molecule/ substrate and electric field geometry to the plasmon-induced Raman spectra in a joint spectroscopic-theoretical approach. The novel insights we obtain on the role of geometry and charge-transfer, specifically affecting high- and low-frequency vibrations, can be extended to semiconductor substrates for which the CM is supposed to dominate. Moreover, surface functionalization of multifunctional sensors with ultrathin layers of CoPc offers an indirect way to monitor charge- transfer phenomena and external parameters that affect the surface geometry, such as strain and mechanical deformation. Additionally, quantum chemical simulations at the density (DFT) and time-dependent DFT (TDDFT) levels of theory are used to explain the orientation-dependent Raman spectra of CoPc as well as charge-transfer in a plasmonic hybrid system (CoPc@Au) under nonresonant and resonant conditions at the molecular level.
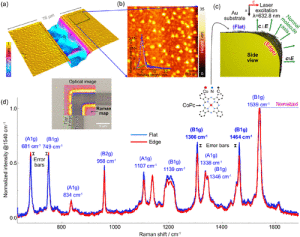
Figure 1. (a) Atomic force microscopy image of the Au-coated SiO2/Si sample showing two edges and flat regions. (b) Zoom-in of the region marked by the rectangle in (a) shows the local roughness of the Au substrate and Au clusters’ presence. The surface roughness is also quantifiable in the histogram shown in the right inset. (c) Schematics of CoPc orientation on the edge and flat regions of interest of a gold-coated structure. (d) Normalized Raman spectra to the CoPc CC mode at 1539 cm−1 averaged over the flat and edge regions marked in the Raman hyperspectral image shown in the inset.
Image: Stefanie Gräfe■ RESULTS AND DISCUSSION
We carried out a systematic Raman spectroscopy investigation of CoPc for several substrates, including Au nanostructures, Au-SiO2/Si interface, SiO2/Si flat vs Au films on nanospheres (FON), Ag-FON vs Au-FON, and Ag-FON vs flat Ag. The CoPc molecule features 165 vibrational normal modes (3N-6), of which in gas phase 68 normal modes are Raman active with symmetries A1g(14), B1g(14), B2g(14), Eg(26), 64 normal modes are infrared active with symmetries A2u(8), Eu(56), and the other remaining symmetries A2g(13), Au1(6), B1u(7), B2u(7) are silent modes.46
Geometry Contribution to SERS: Edge vs Flat Au. To minimize the influence of chemical contributions, we first investigate a substrate with the same composition but strong geometrical differences. This substrate shows flat and edge regions along a trench made on a Si chip coated by an Au film. We analyzed the substrate topography on the flat regions and around the trench’s edges by atomic force microscopy. The results are presented in Figures 1a and 1b measured after deposition of molecules on the surface. The images highlight the surface roughness of the Au-coated Si sample, mainly originating from Au clusters. The clusters have a height distribution in the range of 2−10 nm, as shown in the histogram in the inset in Figure 1b, while the height of the Au film with respect to the SiO2/Si substrate is about 13 ± 2 nm (see Figure S1).
Figure 1c shows the schematic adsorption of CoPc on the flat and edge corner regions on a gold-coated sample; arrows indicate the incident electric field polarization and normal vectors to the molecule plane. While the incident polarization is constant, the normal molecule’s plane vector follows the substrate orientation.
Figure 1d shows the hyperspectral Raman imaging on both flat and edge corners. All spectra used to calculate the averages are presented in Figure S2. We observed that the Raman maps in Figure S3 for the peak position of LFM and HFM show no contrast between the gold edges and the flat gold surface, only changes below ±1 cm−1.
The Raman vibration frequencies calculated for free gas- phase molecules are not always appropriate for comparing the Raman spectra from adsorbed molecules.47,48 Nevertheless, a comparison between these calculations and experiments is an approximate starting point that allows peak assignment, and thus, to understand the spectral features observed exper- imentally. In the present case of CoPc, the Raman active modes in gas-phase allow a preliminarily assignment of the respective vibrational modes upon surface immobilization, i.e., for the in-plane vibrational modes at 681 cm−1 (A1g), 749 cm−1 (B1g), 834 cm−1 (A1g), 958 cm−1 (B2g), 1107 cm−1 (A1g), 1139 cm−1 (B1g), 1306 cm−1 (B1g), 1338 cm−1 (A1g), 1346 cm−1 (B1g), 1464 cm−1 (B1g), 1539 cm−1 (B1g).
An interesting feature of the Raman spectra regards the vibrational modes at 958, 1107, 1306, and 1464 cm−1 that have higher intensity on the Au flat surface than other Raman bands measured on the edge region. On the other hand, the modes at 681 and 749 cm−1 show a minor enhancement on the edge region than the molecules on the flat Au surface. However, intensity variations above the error bars are exclusively observed for high-frequency modes (HFM), as evident from the normalized spectra in Figure 1d. This difference occurs due to the relative orientation between the electrical field of the Raman laser excitation and the molecule plane. At the edge, the electric field is parallel to the in-plane vibrational modes, which is opposite to the case of flat-lying molecules on the flat Au. In this latter case, the electric field direction is perpendicular to the molecular plane. It is important to notice that the low-frequency mode (LFM) at 681 cm−1 corresponds to the C−Nm−C in-plane bending and isoindole expanding while the 749 cm−1 is assigned to the C−Nm−C, N−M stretching and pyrrole expanding. We attribute the band at 749 cm−1 to the B1g symmetry mode instead of the Eg mode as suggested by its Raman intensity, while minor peak shifts may result from adsorption.46,47 These vibrational modes are related to interactions involving the central metal atom; see Tables S1 and S3 for additional details.
The HFM region is mainly dominated by three Raman bands at 1306, 1464, and 1539 cm−1. The vibrational mode at 1306 cm−1 corresponds to the stretching of the isoindole and N−Co bonds coupled to C−H in-plane bending vibrations. The peak at 1464 cm−1 involves C−H bond vibrations coupled with the stretching of Cβ−Cβ bonds (carbon bonds between pyrroles and benzene rings). The vibrational mode at 1539 cm−1 refers to stretching of the C−Nm−C bonds as well as pyrrole rings expanding coupled with C−H vibrations according to DFT calculations by Liu et al.46 Thus, the HFMs always involve coupling to the C−H vibrations, see Tables S1 and S3.
Conclusively, the electric field direction governs the relative intensity of vibrational modes of molecules adsorbed flat on Au (parallel polarization, HFM) in a different fashion as for Au edge adsorption (with perpendicular polarization, LFM). All HFMs involveat least partiallya coupling to the C−H bonds, which results from the nonplanar distortion of CoPc upon surface immobilization.
The stacking of CoPc and multilayers’ formation were studied previously on an Au(111) substrate by STM. It was shown that three CoPc layers feature distinct nonplanar deformation, i.e., the first layer molecules are planar, but for the second and third layers, molecules grow tilted 3° and 4°, respectively, along the [11̲0] direction of the Au(111) surface.49
Experimental results previously reported show that HFMs of CuPc are sensitive to the surface parallel orientation of 2D materials,50 while the vibrational frequency at 681 cm−1 is not strongly dependent on the parallel orientation. Also, this behavior is similar to the 749 cm−1 vibrational mode because the slightly higher enhancement intensities for the LFMs are related to vibrations of the central metal ion that are more sensitive to perpendicular polarization. Given that the differences in LFMs were within the error bar (see Figure 1d), we carried out Raman experiments on nanospheres, which, thanks to their relatively large-scale curvature, provide the means to investigate geometrical effects further.
SERS: SiO2/Si vs Au and Au-SiO2/Si Interface.
Contributions from the substrate to the molecule’s vibrational modes can be assessed by changing “surface chemistry”. Thus, for comparison with the experimental results discussed above, we carried out experiments on a flat Au substrate, a SiO2/Si surface, and the interface between these two (Au-SiO2/Si). The comparison is simplified (and justified) since the CoPc layer was simultaneously deposited on all these regions under the same experimental conditions. We also performed the Raman experiments under the same conditions in all these regions.
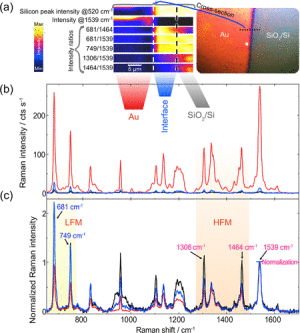
Figure 2. (a) Raman maps of selected signal intensities and ratios; see labels. The color scale (blue to yellow) shows the increase in intensity. (b) Raman spectra averaged over the Au and SiO2/Si sides of the CoPc-coated sample and the Au/SiO2/Si interface. The inset shows the optical microscopy image of the sample taken during the Raman analysis. (c) Normalized Raman spectra to the CoPc CC mode at 1539 cm−1.
Image: Stefanie GräfeIn Figure 2a, we present the hyperspectral Raman imaging results obtained around the Au-SiO2/Si interface. Once more, we focused on the intensities and intensity ratios observed for the LFMs and HFMs. The spectra averaged from the three regions of interest are presented in absolute (Figure 2b) and normalized (Figure 2c) scales. All spectra used to calculate these averages are presented in Figure S4. Hence, spectral differences of CoPc deposited on the flat Au surface, SiO2/Si (conventional nonenhanced spectrum), and the Au- SiO2/Si interface were observed.
The molecules on SiO2/Si have higher intensity modes in the high-frequency range (1306 and 1464 cm−1) in comparison to the Au-SiO2/Si interface and Au flat. The mode at 958 cm−1 is another interesting Raman band with higher intensity than the normalized vibration peak at 1539 cm−1. This mode at 958 cm−1 indicates considerable molecule deformation upon adsorption on the SiO2/Si compared to the molecule on Au. The more pronounced molecular deformation on SiO2/Si is because the vibrational mode is related to the N−M, C−Nm− C in-plane bending that couples to the isoindole deformation, see Table S1 and S3.46 A few experiments of CoPc on native oxide were reported. CuPc on native SiO2/Si was studied by near-edge X-ray absorption spectroscopy (NEXAFS), showing that the molecules are standing on SiO2/Si in disordered adsorption. This is an entirely different case to the flat-lying adsorption of the molecules on Au. The enhancement of this vibrational mode at 958 cm−1 was observed in other Raman studies of CuPc/SiO2/Si in which this peak’s intensity exceeded other vibrational modes observed in the Raman spectra, including polarized Raman.50,51 CoPc is expected to feature similar adsorption on native oxide SiO2 as indicated by the large signal difference of this vibrational mode compared to the molecule on gold, see Figures 2c and 3c. This result was also observed by the CoPc growth on SiO2 at elevated temperatures investigated by X-ray diffraction (XRD), evidencing molecules adsorbed in a standing configuration.52
We also recognize the possibility of charge-transfer to CoPc mediated by the SiO2 as previously reported for substrate- induced doping of graphene.53,54
These intensities are not expected to be achieved by adsorption of CoPc on the pure Si surface where the molecule shows flat-lying adsorption. The adsorption of CuPc on Si(111) (7 × 7) shows an apparent flat-lying absorption with different intramolecular contrast because of the interaction with Si dangling bonds.55 Although the STM images were acquired at low resolution, for images measured at 1.6 V, some molecules were transparent due to the LUMO orbital’s higher energy level position; in the same sample area, other molecules were observed as bright protrusions. In contrast, at lower positive bias voltage, CuPc molecules appeared as vacancies due to the interaction with the Si surface’s dangling bond.55
Similarly, CoPc adsorbed on Si(100)2 × 1 shows different intramolecular contrast and higher stability for molecules with stronger molecular interaction with Si dangling bonds. STM images show a similar transparency phenomenon for a negative bias voltage from −2.5 V to −1.3 V.56 Recently, a similar behavior was also observed for the coronene molecule on Si(111) and explained as preferential molecule adsorption on the center adatoms of the Si unit cell affected by the interaction of the dangling bond with the molecule.57 STM studies in the case of CoPc suggested that the molecule can be adsorbed flat on the Si surface, but preferential absorption on some of the nonequivalent reaction sites is also possible. However, some CoPc molecules can be weakly adsorbed for different reactive sites of the Si surface cell as visualized for CuPc on Si. However, further experimental work should be carried out to confirm this expectation. The molecules may have a stronger interaction with the Si substrate due to the interaction with dangling bonds of the central Co atom and even higher symmetry reduction of the CoPc than on Au and Ag metals. We noticed, however, that Si surfaces exposed to ambient conditions get readily oxidized. Thus, the effect of this native oxide layer should not be overlooked when considering the adsorption configuration of CoPc or any other organic molecule.
Similar to the case of CoPc layers on Au, for high coverage films reaching several hundreds of nanometers, CoPc on silicon substrates have higher tilt angles of up to 48°.58 At higher CoPc coverage (50−400 nm) on n-Si(001), such parameters as deposition rate, substrate temperature, layer thickness, and evaporation method affect CoPc thin layers orientation.58 These parameters influence the structure arrangement and thin layer sequence. For these CoPc thin layers, major changes were observed in the spectral range from 1350 to 1550 cm−1.58
Our results for CoPc adsorbed on the Au-SiO2/Si interface and on SiO2/Si are presented in Figure 2c. The normalized spectra show higher intensities for LFMs, which contrasts with the results obtained from flat or edge gold structures. We also observed higher HFM intensities, although to a lower degree. These differences between the flat surfaces and the interface are because the adsorption process of CoPc at the Au-SiO2/Si interface has higher roughness, irregular borders, and different electronic structure. Besides, light depolarization at the interface contributes to the changes observed, like the slightly higher HFM. Moreover, at the interface, not all CoPc molecules are expected to be adsorbed parallel to the substrate but having different orientations59 while reducing the Raman scattering of high-frequency vibrations.
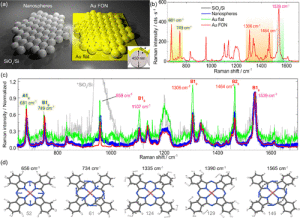
Figure 3. (a) Schematics of the nanospheres and metal film on nanospheres (MFON) deposited on a silicon substrate, with and without 80 nm thick gold coating. (b) Raman spectra averaged over the different regions depicted in (a). (c) Raman spectra normalized to the CC peak around 1539 cm−1, the plot legend is the same as in (b). (d) Displacement vectors of prominent vibrational modes contributing to the simulated Raman spectrum as well as to the x, y-, and z-polarized Raman spectra under nonresonant (1064 nm excitation) and resonant conditions (633 nm excitation), see Figure S6 and S7, and Tables S2 and S3 for more details. The numbers at the bottom represented the vibrational modes listed in Tables S2 and S3. Raman and resonance Raman spectra were obtained at the (TD-)B3LYP10/def2-SVP level of theory, see Computational Details.
Image: Stefanie GräfeSERS: Polystyrene Nanospheres vs Au-FON, Au, and SiO2/Si Flat. We show in Figure 3a a sketch of nanospheres and metal film on nanospheres (MFON) deposited on a silicon substrate, with a remarkable difference in the Raman spectra in Figure 3b. The 80 nm gold thickness is large enough to decouple any effect in CoPc from the Si substrate underneath. Therefore, it is justified to assume that, in both cases, the chemical contribution to the spectra is comparable and originates from the Au-CoPc interaction. We observe that the LFMs at 681 and 749 cm−1 have the same intensity ratio in the CC normalized spectra. However, this is not the case for the HFMs at 1306 and 1464 cm−1. These comparative results for the Au/Si interface and flat Au are qualitatively identical with the case of Ag FON and flat Ag film on Si (see Figure S5). Figure 3c illustrates a remarkable intensity increase for the HFM at 1306 and 1464 cm−1 in the case of CoPc adsorption on flat Au(111). Such intensity peak enhancement implies a significant interaction between CoPc and a thin gold layer. This observation agrees with previous STM results60 for which, at room temperature, a thin CoPc submonolayer (0.4−0.8 layers) tends to adsorb at random orientations on gold. This result further proves the strong interaction at the CoPc Au(111) interface.33 Therefore, the predominant vibrations in CoPc are dominated by the strong Co−Au coupling.33 This interaction determines the adsorption and the intensities of isoindole scaffolding and C−Nm−C (681 cm−1) in-plane bending and C−Nm−C and N−Co stretching (749 cm−1) vibrational modes.
Ultraviolet photoelectron spectroscopy (UPS) results and angle-resolved UPS (ARUPS) for CoPc on Au(111) by Rehman et al.60 proved that the shift in the valence band, as well as the work function decrease from clean Au(111) surface (5.32 eV) to thick CoPc film (5.25 eV), are consequences of strong adsorbate−substrate interaction.
Also, there is an intensity mismatch of over +50% for HFMs at 1306 and 1464 cm−1. The inhomogeneous intensity increase between LFMs vs HFMs was observed a long time ago in SERS investigations reported by Bartholomew, Connell, and Smith.61 Even though the authors did not call it SERS at that time, their experiments of CoPc mixed with Ag particles using different laser excitation energies evidenced the role of dynamic Jahn−Teller distortions in the CoPc Raman spectra. The CoPc electronic excitation gives rise to optical absorption
bands in the UV-blue (Soret band ≈340 nm) and red (Q-band ≈ 620 nm) spectral ranges, mainly originating from the population of π−π* states of the ligand sphere.61 The basis for rationalizing these observations lies in the nature of the vibrational modes involved. LFMs feature large displacements of the outer N atoms, C−Nm−C in-plane bending/stretching, and isoindole/pyrrole stretching. In contrast, HFMs involve displacements of the C−Nm−C moiety and C−H bond vibrations coupled with the C−C bonds stretching of the outer ligand, i.e., the benzene rings, see Tables S1 and S3. The evidence of geometry contribution to HFM is also visible in the comparison between Ag FON and a flat Ag-coated surface with experimental results shown in Figure S5.
We follow our recently reported fully quantum mechanical approach to assess the entire CM in plasmon-enhanced Raman spectroscopy comprising nonresonant, resonant, and charge- transfer contributions.18−20 Thereby, we consider exclusively A-term contributions, while B-term contributions are currently not implemented in our custom code, see section Computa- tional Details. These first principle methods provide a theoretical complement to our experimental results. In this context, we performed DFT and TDDFT simulations to assess the nature of these vibrational modes contributing to the Raman spectrum upon 633 nm excitationfirst for CoPc in gas-phase. TDDFT reveals that this laser energy is in electronic resonance with two bright excited doublet states, D5 and D6, mainly localized on the ligand sphere. This resonance condition implies that, to be more accurate, we are dealing with surface-enhanced resonance Raman spectroscopy (SERRS). Both D5 and D6, excitations are polarized in x and y-direction, respectively, given by the aromatic plane. Thus, a pronounced orientation effect is to be expected for the molecular CoPc system, in agreement with our experimental observations, with the resonant signal originating exclusively from these xy-polarized excitations, see Figure S7 and S8. However, the relative resonance Raman intensities of LFMs and HFMs or rather the intensities of totally symmetric and nontotally symmetric modes of the isolated CoPc are likely sensitive to the vibronic coupling, as given by Albrecht’s B- term. Such vibronic terms account for Herzberg−Teller contributions62,63 and originate from the coupling of a strong dipole allowed transition, i.e., excitation into the ππ* state D5 or D6, with an energetically close weakly allowed transition, i.e., excitation into the ππ* state D6 or D5. Consequently, partial mixing of both ππ* states contributing to the x/y-polarized resonance Raman signal is expected. The simulated resonance Raman signal in z-direction only stems from a slight nonplanar distortion of CoPc as no (biased) initial symmetry restrictions were applied in the structural equilibration performed at the DFT level of theory. The quantum chemical simulations reveal that the vibrational modes 52 and 61 at 656 and 733 cm−1 of the central indole fragments depicted in Figure 3d contribute to the low-frequency range, while the high-frequency range is dominated by intense Raman signals stemming mainly from the C−Nm−C moieties, the stretching of C−C bonds, and outer CH-modes 124, 129, and 146 at 1334, 1389, and 1548 cm−1, see the Supporting Information for details, Tables S2 and S3.
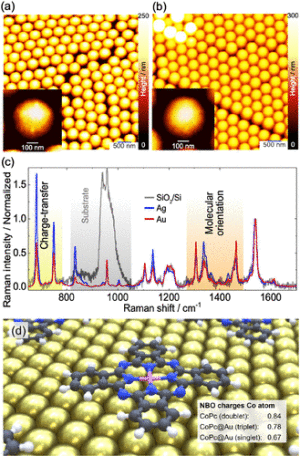
Figure 4. Atomic force microscopy imaging of (a) Ag-coated and (b) Au-coated nanosphere samples. The insets show zoom-in individual nanospheres with no significant changes in the surface structure. (c) Raman spectra from the Ag- and Au-coated samples, including the CoPc film spectrum on SiO2/Si. All spectra were normalized to the CC vibration intensity. (d) Hybrid system investigated using two- dimensional periodic boundary conditions; charges of the Co atom in the CoPc (gas phase, doublet) as well as in CoPc@Au (more stable triplet and singlet) as obtained by Natural Bond Orbital analysis are indicated, see Table S8 for details.
Image: Stefanie GräfeFurther simulations were performed for a CoPc molecule immobilized on an Au(111) surface to assess the CM in the respective plasmonic hybrid system (CoPc@Au). Therefore, a single CoPc molecule was relaxed on an Au cluster comprising 147 atoms using two-dimensional periodic boundary conditions (Figure 4d). In particular, these simulations on the plasmonic hybrid system aim to allow a quantitative evaluation of the proposed charge-transfer between the gold surface and the immobilized CoPc, which is key to the present joint spectroscopic-theoretical investigation. Subsequently, the polarization-dependent Raman and resonance Raman spectra of the hybrid system were obtained for a closed-shell singlet as well as for an opened-shell triplet species; the latter triplet configuration was found to be energetically more favorable than the singlet by 0.34 eV. CoPc@Au’s triplet species features, like CoPc in gas-phase, a semioccupied dz2-orbital of the Co atom, while the second unpaired electron is found in a molecular orbital of the gold cluster. In agreement with previous STM studies,41,42 our calculations showed a reduction of CoPc’s symmetry from C4 in the gas phase to C2 upon surface-immobilization, i.e., on Au(111). Resonance enhance- ment upon 633 nm excitation was assessed for both species: singlet and triplet. Surprisingly, both species display very
similar Raman signals at the given excitation wavelength, while the relative intensity of the LFMs, i.e., modes 59 and 75 at 655 and 755 cm−1 (triplet species), are enhanced significantly with respect to the HFMs, i.e., 127, 147, and 150 at 1300, 1520, and 1535 cm−1, in contrast to the isolated CoPc (gas-phase). Conspicuously seems the very strong Raman signal of the total symmetric ring breathing mode at 817 and 820 cm−1 for singlet and triplet, respectively, see mode 79 in Figure S9 and S10. We correlate the high intensity of this mode to the nonperiodic setup for the (resonance) Raman simulations as this mode is presumably quenched by neighboring CoPc molecules in a monolayer. A closer look at the x-, y-, and z- polarized resonance Raman signal (Figure S9 and S10) shows that the molecular symmetry is partially broken as evident from the intensity mismatch in x and y direction.
Additionally, the z- component of the simulated resonance Raman spectra is considerably enhanced but still approximately 8 orders of magnitude weaker than the x- and y-polarized spectra. The overall rather similar pattern of the x-, y-, and z-polarized resonance Raman spectra (Figure S9 and S10) results from the pronounced mixing of z-polarized charge-transfer excitations from the gold surface to the π-system of the immobilized CoPcwith local xy-polarized excitations of CoPc. Further details regarding the computational results on the polarization- dependent Raman and resonance Raman spectra as well as with respect to the nature of the charge-transfer and local excitations contributing to the resonance enhancement are collected in the Supporting Information (Figure S9−S18 and Tables S4−S7).
Chemical Enhancement in SERRS: Ag-FON vs Au- FON. We studied other plasmonic systems to test the generality of our observations deduced from the results discussed above. This last system is composed of nanospheres coated with Ag or Au. The topography visualized by AFM is presented in Figure 4a and Figure 4b for Ag and Au, respectively. The Raman spectra from these two samples and CoPc on SiO2/Si are shown in Figure 4c. Results in Figure 4c show a large difference between the intensities of the normalized spectra obtained from Ag-coated (Figure 4a) and Au-coated nanospheres (Figure 4b) in the LFM spectral region (681 and 749 cm−1). The Ag-coated nanospheres peak intensities far exceed the intensities obtained from Au-coated nanospheres. The higher enhancement can be related to different electronic interfaces between the two metal substrates. In the case of the silver substrate, an even stronger impact of charge-transfer is expected. Moreover, recent X-ray and UV photoelectron spectroscopy (XPS, UPS) results show a bidirectional charge-transfer for CoPc on both monocrystal- line metals Ag(111)64 and Au(100).65 This observation confirms charge-transfer’s occurrence from the metal substrate to the Co atom and the back-donation charge-transfer from the macrocycle to the substrate. The lowest binding energies for the Co 2p3/2 spectra show closer values for gold66 (polycrystal- line, Au(100)) and Ag(111).64 However, X-ray absorption spectroscopy (XAS) of Co L2,3 on Ag(111) shows a feature at the low-binding energy suggesting the existence of two energy levels that differ for both metals.67 This slight energy shift for silver opens the possibility to enhance the electron population efficiency at this unoccupied state under localized surface- plasmon excitation. Consequently, compared to the case of Au, there is an enhancement of charge-transfer between the semioccupied dz2-orbital (a1g) of the Co atom and the Ag substrate; see the spin density of CoPc@Au’s triplet groundstate (T0) in Figure S17 and S18 (D0 spin density of isolated CoPc shown in Figure S8).
Further evidence for a charge-transfer between the Au surface and the Co atom of the immobilized CoPc within the electronic ground-state was obtained employing natural bond orbital (NBO) analyses. The DFT simulations reveal in the case of CoPc a charge of the Co atom of 0.84, while both spin states of the CoPc@Au hybrid system feature with 0.78 (triplet: favored by 0.34 eV) and 0.67 (singlet) a less positive charge of the Co atom, see Figure 4d. Thus, a charge-transfer from the gold cluster to CoPc, i.e., into the dz2-orbital of the cobalt atom, proceeds within the ground-state upon immobi- lization, see Figure S19 and Table S8 for details. The higher charge-transfer in Ag FON leads to increased Raman intensities, predominantly for LFMs, as observed in the normalized spectra. In contrast to the Ag FON, the Raman spectrum obtained from a flat Ag-coated silicon substrate presented in Figure S5 shows a decrease in the LFMs intensities due to the less efficient hot electron generation (and thus lower charge-transfer). The Raman intensity ratio map changes between an LFM@680 cm−1 and an HFM@1464 cm−1 are presented in Figure S20. This map, overlapping the optical microscopy image, was made from the same data set used in Figure 1b discussed above. Besides the intensity ratio, temperature-dependent studies of bulk CoPc in Figure S21 show the negligible change in peak position for the LFMs compared to the large redshift observed for HFMs. The critical points in CoPc thin films’ heating are the molecular structure transformation and the polymorphic phase change. Initially, CoPc molecules have a planar structure with D4h symmetry. However, phthalocyanine molecules’ symmetry changes at high temperatures from D4h (planar molecule) to C4v (distorted molecule).68 The CoPc thin layer orientation is influenced by this transformation caused by the average Co−N distance increase in the molecule, changes in the molecule planarity, and molecular symmetry.58 Thus, we observe one more time the impact of the geometry on the HFM.
Different plasmon resonance responses between Ag and Au FON could influence the LFM and HFM intensity ratios comparison. This effect would be significant if the LSPR width is smaller than the corresponding energy (wavelength) differences between LFM and HFM (Δλ of about 40 nm, see Figure S22). If the plasmon response is broad, then we expect that this effect plays a minor role. These MFON SERS surfaces have high dispersion in terms of hotspot size and formation because of the fabrication procedure that does not provide a homogeneous size of the crystallites and spacing. The dispersion in hotspots naturally leads to a very wide LSPR that depends not only on the material but also on the
69−71 nanosphere size and metal thickness.
We justify neglecting dispersion effects by considering the intensity ratio changes for Raman peaks observed within the same spectral range (<2 nm apart, marked in Figure S22) that are the opposite for Ag and Au FON, which different LSPR responses cannot explain. However, a direct experimental determination of the optical response from these MFON opaque substrates in follow-up work could provide definite evidence on enhancing contributions that do not originate from geometry or charge-transfer effects.
In summary, these collective results obtained from different plasmonic nanoparticle systems and substrate geometries show that LFMs and HFMs are preferentially sensitive to different kinds of perturbations. The peak position maps for the case of Au show no changes for edge or flat regions (see Figure S3). However, for the case of Ag the situation is more complex. These differences between gold and silver could be related to Ag’s strong hot electron generation capability compared to Au, which depends on the electron mean-free path that makes plasmon decay into hot electrons possible. Our results make us now consider in follow-up work the impact of geometry on charge-transfer in plasmon photocatalysis and energy harvest- ing that are critical applications intensively investigated in material science, nano-optics, chemistry, and biomedical applications SERS.72,73
■ CONCLUSIONS
This work shows that besides the conventionally accepted chemical enhancement mechanism in SERS, the molecule’s geometry and orientation also induces changes in intensity ratios in the plasmonic-enhanced Raman spectra. This conclusion was derived from a systematic investigation of the molecule−substrate and electric field geometry effects on the Raman spectra, evidencing the impact of geometrical and chemical contributions. Our Raman spectroscopy results on different substrates evidenced that high-frequency modes (HFMs) are susceptible to molecular orientation changes. This result contrasts with low-frequency modes (LFMs) that are most sensitive to charge-transfer between the molecule and substrate. The latter effect was evidenced for ultrathin films of CoPc on Ag and supported by two-dimensional periodic quantum chemical simulations. The quantum chemical modeling allowed to evaluate the charge-transfer contribution in-depth and revealed already in the electronic ground state a considerable charge-transfer from the plasmonic gold surface to the CoPc molecule. Furthermore, theoretical results obtained at the density functional and the time-dependent density functional levels of theory addressing the orientation dependency of isolated CoPc as well as of plasmonic hybrid system (CoPc@Au) showed that LFMs and HFMs are driven by inner N−C and outer C−H vibrations, respectively. Due to the Co ion’s influence, which is directly affected by charge- transfer, the N−C driven vibrations (LFMs) are less affected by external geometrical or temperature stimuli than the outer ring vibrational modes (HFMs). Temperature-dependent results show that heating also selectively affects high-frequency modes’ peak position, supporting the observation of specific vibrations affected by geometrical changes and external perturbations. Besides pushing forward our understanding of underlying spectroscopic changes in plasmonic-hybrid systems, these new insights on SERS open new possibilities to exploit CoPc as an ultrasensitive molecular probe to monitor environmental changes and charge-transfer events.
■ EXPERIMENTAL DETAILS
The schematics of metal film over nanospheres (MFON) is shown in Figure S23. The polystyrene nanospheres with 900 nm diameter were deposited on a silicon substrate. Then the metal films with 80 nm thickness were fabricated on the self- assembly nanosphere arrays in a physical vapor deposition system. Afterward, ultrathin (1 and 2 nm) layers of cobalt phthalocyanine (CoPc) respectively were deposited using organic molecular beam deposition (OMBD) in a high vacuum.
Raman spectroscopy of bulk CoPc temperature-dependent measurements were performed with a micro-Raman spectrometer LabRam HR800 (HORIBA). Spectra were obtained using 632.8 nm HeNe laser (Siemens) with laser intensity measured at the sample of 20 mW. The laser spot size focused on the sample was about 3 μm with a 10× objective (numerical aperture, N.A. = 0.25). The laser excitation and signal collection were in the backscattering configuration. Sample heating was simultaneously performed using a VWR heating plate under the nitrogen atmosphere and Raman spectroscopy was taken every 25 °C from 25 to 425 °C.
■COMPUTATIONAL DETAILS
All quantum chemical calculations determining structural and electronic properties of the present cobalt(II) phthalocyanine (CoPc) were performed using the Gaussian 16 program.74 Fully relaxed equilibrium geometries, without applying initial symmetry restrictions, were obtained within the doublet and quartet ground state. All ground-state calculations were performed at the (unrestricted) density functional level of theory (DFT) utilizing a functional based on B3LYP,75,76 comprising 10% of exact-exchange, 58.5% of nonlocal B88 exchange and the LYP correlation, which is denoted B3LYP10. The def2-SVP basis77,78 as well as the respective core potentials were applied for all atoms. A subsequent vibrational analysis was carried out for the fully optimized ground state structure to verify that a minimum on the potential energy (hyper)surface (PES) was obtained. To correct for the lack of anharmonicity and the approximate treatment of electron correlation, the harmonic frequencies were scaled by the factor 0.95.79 All subsequent simulations are performed exclusively for the more stable low-spin (doublet multiplicity) species of CoPc, with the unpaired electron being localized mainly in the dz2-orbital of the cobalt atom (see the spin density of D0 in Figure S8).
Excited-state properties such as excitation energies, oscillator strengths and electronic characters were calculated within all equilibrium structures at the time-dependent DFT (TDDFT) level of theory. Therefore, the 100 lowest excited states were calculated within the doublet ground state equilibrium, while the same XC functional, basis set, and core potentials were applied as for the preceding ground-state calculations. Several joint spectroscopic-theoretical studies on structurally related metalloporphyrins proved that such computational protocol enables an accurate prediction of the ground and excited-state properties with respect to experimental data, e.g., UV−vis absorption, spectroelectrochemical properties as well as Raman and resonance Raman spectra.80,81 All calculations were performed including D3 dispersion correction with Becke− Johnson damping.82
With respect to a realistic SERS setup, the CoPc sample is surface-immobilized (ideally flat) on a (e.g., gold) nanoparticle. In first-order approximation, such a nanoparticle is planar in the dimensions of the sample (CoPc: 12.36 Å × 12.36 Å). In the case of a monolayer, this surface plane is parallel to the aromatic plane of CoPc; in the present study, the molecule is aligned to the xy-plane, with the origin in of the Cartesian coordinates given by the central Co atom. In contrast to tip- enhanced Raman spectroscopy, where the sample’s Raman signal is obtained exclusively in z-direction, the SERS signal originates from an average of different sample-nanoparticle orientations along x, y, and z-direction. Consequently, all three trace components, αxx, αyy, and αzz, of the polarizability tensor α are subjected to the electromagnetic enhancement (assuming parallel electric field vectors).
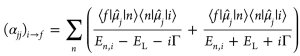
Within the so-called sum- overstates expression as derived by Kramers, Heisenberg, and Dirac the three trace components of α are given by this formula, where μ̂j is the respective component of the dipole moment operator in x, y, or z-direction, En,i the Bohr energy for a transition between the two vibronic states i and n defined as En,i ≡ En − Ei, EL the energy of the irradiating laser, and Γ the damping factor describing homogeneous broadening (0.372 eV).
Image: Stefanie GräfeEq 1 comprises a resonant term (first) and a nonresonant term (second). The latter term as well as its partial derivative is obtained by standard (ground-state) frequency calculations, while an excitation energy of EL = 1.17 eV (λL = 1064 nm) was assumed.
Transition polarizabilities and their derivatives are obtained for a fundamental transition (g0l → g1l), i.e., a transition from the vibrational ground-state of the l-th vibrational mode of the electronic ground-state (g0l) to its first vibrational excited state (g1l) within the transform theory62,85−89 assuming exclusively Condon-type scattering (A-term contribution88). Detailed information on the simulation of resonance Raman intensities is reported in references62,90 and references therein.
In the case of the present CoPc, the resonance Raman intensities have been calculated for the excitation wavelength of 633 nm and taking into account contributions from the doublet excited states involved in the absorption within the visible range, i.e., D5 and D6. Further details regarding the electronic nature of excited states in resonance at 633 nm excitation (EL = 1.96 eV) are provided in Tables S4, S5. All z- polarized Raman signals under nonresonant and resonant conditions were broadened by Lorentzians with a full width at half-maximum (fwhm) of 10 cm−1.
In addition to the simulations addressing the photophysical properties of the isolated CoPc, quantum chemical calculations were performed on a CoPc immobilized on a gold(111) surface to mimic the chemical effect in the scope of SERS. Therefore, our lately established computational approach to assess nonresonant and resonant contributions of the so-called “chemical effect” in tip-enhanced Raman spectroscopy18,20,91 was adapted to describe plasmonic hybrid systems in the frame of SERS. In the first step, one CoPc molecule was optimized on top of a Au(111) slab, comprising 147 gold atoms within three layers (3 × 7 × 7), using the CP2K 7.1 program.92 The CoPc structure was fully relaxed on the frozen Au slab; a single ground state (uncharged) was assumed. Therefore, the (unrestricted) DFT level of theory, utilizing the Pedrew− Burke−Ernzerhof (PBE)93 exchange-correlation functional with periodic boundary condition in xy direction, was applied. For all atoms, Goedecker−Teter−Hutter (GTH) pseudopo- tentials and DZVP-MOLOPT-SR-GTH basis sets94−96 basis sets were used for core and valence electrons, respectively. In a second step, the simulations aiming to assess the ground and excited state properties of the CoPc@Au hybrid system were performed using the Gaussian 16 program. These simulations were performed considering a singlet (closed-shell) as well as a triplet (open-shell) ground state. For computational reasons, the number of gold atoms was decreased from 147 to merely 45 atoms (first layer, minus four edge atoms). The same functional and basis sets were applied as in case of the previous simulations on the isolated CoPc (B3LYP10/def2-SVP). Surprisingly, a vibrational analysis yielded for both multiplicities no imaginary frequency (first mode singlet and triplet mode at 9.6 and 11.9 cm−1, respectively) without reoptimiza- tion at the B3LYP10/def2-SVP level of theory; thus, suggesting in both cases (local) minima on the 3N-6 dimensional PES. However, the open-shell (triplet) system is by 0.34 eV more stable than the closed-shell system (singlet), i.e., the triplet features one unpaired electron in the cobalt’s dx2−y2 orbital and the second unpaired electron within a gold-center molecular orbital. A Natural Bond Orbitals (NBO) analysis97 was performed for CoPc, as well as for the singlet and triplet hybrid systems (CoPc@Au).
Subsequently, both singlet and triplet systems were considered for the evaluation of resonance effects at the TDDFT level of theory. In the case of the closed-shell system, the lowest 440 singlet excited states were calculated, while the lowest 900 excited triplet states were considered within triplet multiplicity. Finally, excited state gradients were obtained for selected excited states, i.e., CoPc-centered and charge-transfer excitations between the Au cluster and the immobilized molecule. In case of the singlet and triplet systems excited state gradients were calculated for S59, S69, S132, S149, S193, S199, S204, S205, S245, S269, S285, S361, S373, and S437 as well as for T208, T279,
T322, T327, T371, T387, T389, T398, T496, T531, T545, T651, T700, T764, and T866, respectively.
Transition polarizabilities and their derivatives were obtained in the same fashion as described previously for the isolated CoPc. Likewise, a damping factor (Γ) of 0.372 eV was applied and an excitation energy of EL = 1.17 eV (λL = 1064 nm) was assumed. Finally, a scaling factor of 0.95 was applied for all vibrational frequencies.79
■ ASSOCIATED CONTENT
The Supporting Information is available free of charge at https://pubs.acs.org/doi/10.1021/acsphotonics.1c00001External link.
■ AUTHOR INFORMATION
Corresponding Authors
Raul D. Rodriguez − Tomsk Polytechnic University, 634050 Tomsk, Russia; orcid.org/0000-0003-4016-1469; Email: raul@tpu.ru
Evgeniya Sheremet − Tomsk Polytechnic University, 634050 Tomsk, Russia; orcid.org/0000-0003-3937-8628; Email: esheremet@tpu.ru